U.S. Dept. of Education – Civil Rights Education Data
This dataset provides over 100 different measures for comparing school experiences by race. The charts shown here point out where the disparities are the greatest between white and Black students in Vermont.
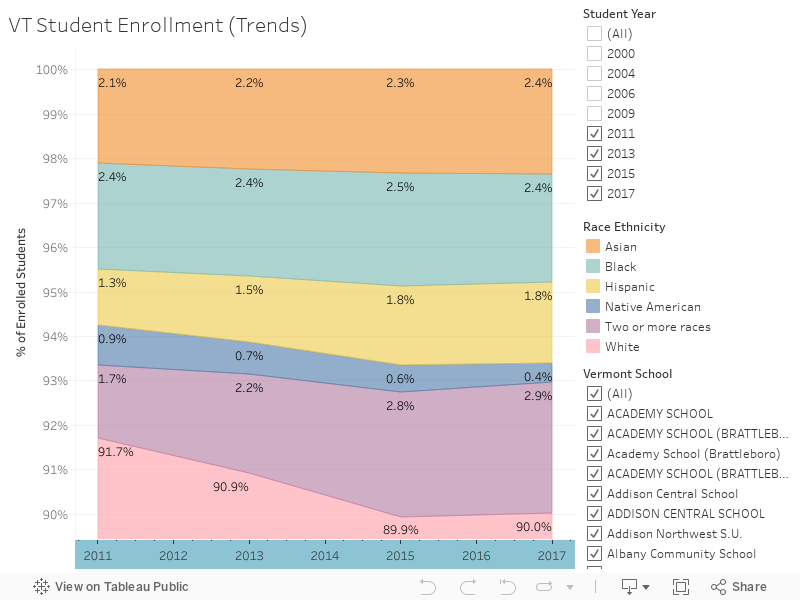
The first chart shows percentages of Vermont students by race for the selected years.
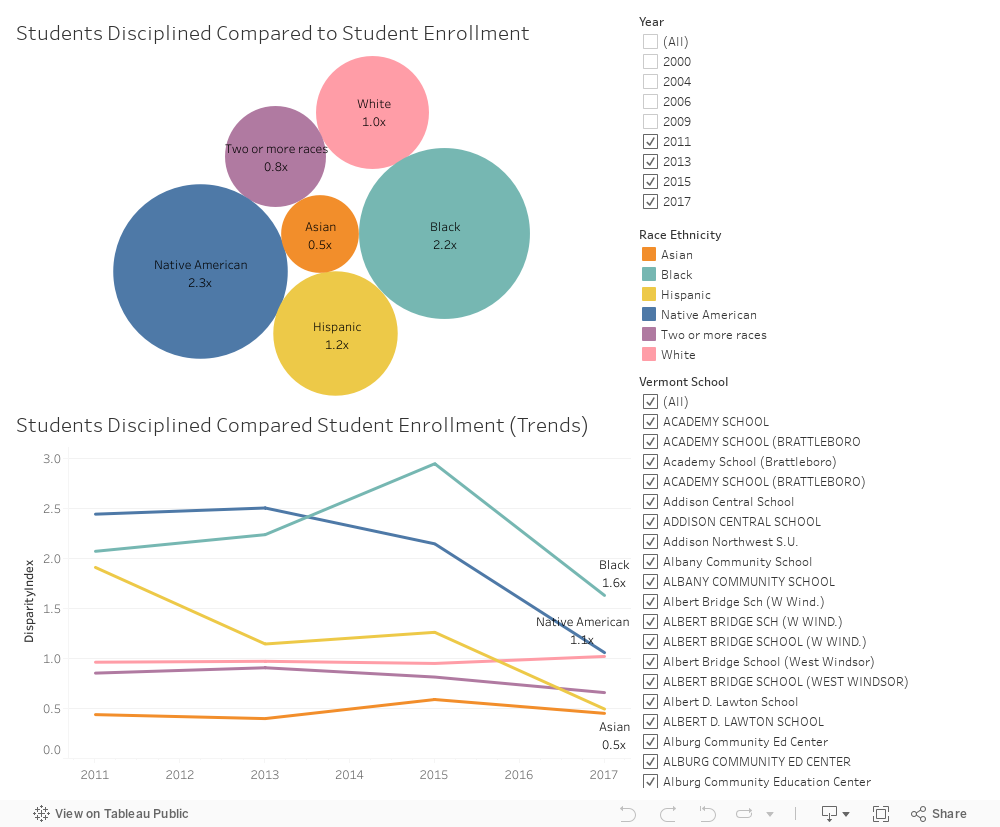
The Student Discipline topic contains eleven different types of discipline including students suspended and students arrested. The following charts combine all eleven types. For 2011-2017, Black students were disciplined at 2.2 times the rate of white students. They include only students without disabilities.
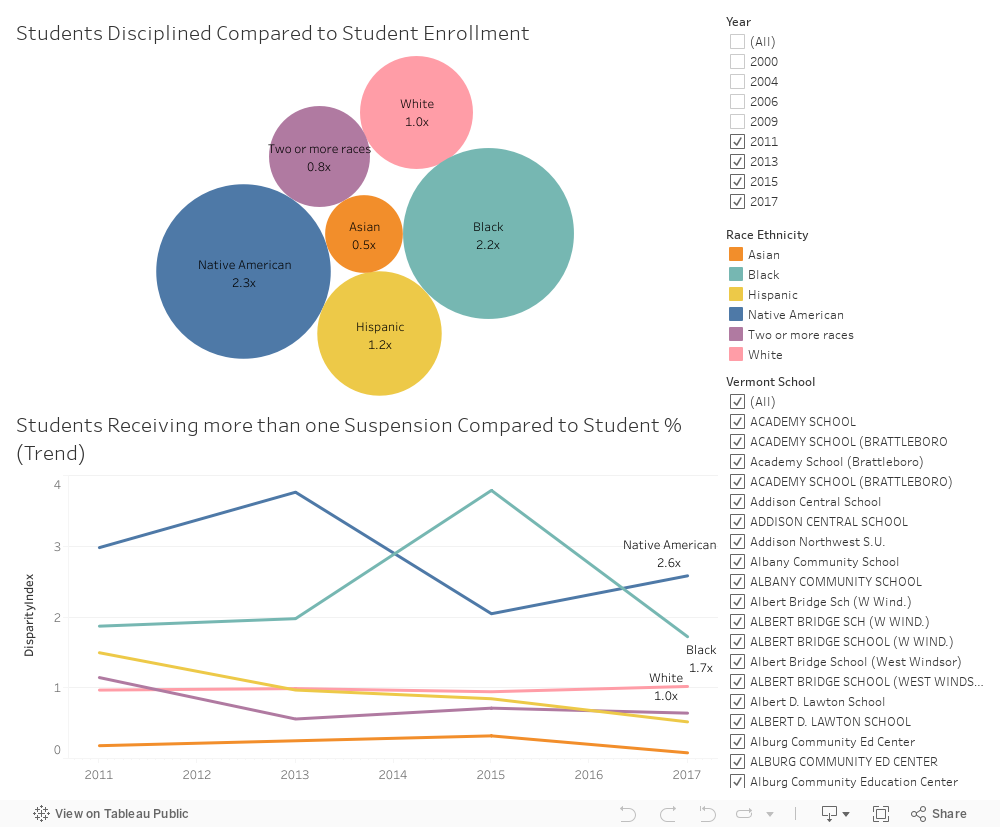
For 2011-2017, Black students received multiple suspensions at 2.4x the rate of white students although the trend in disparity seems to be decreasing. Native Americans were suspended at a high rate also (3.2x).
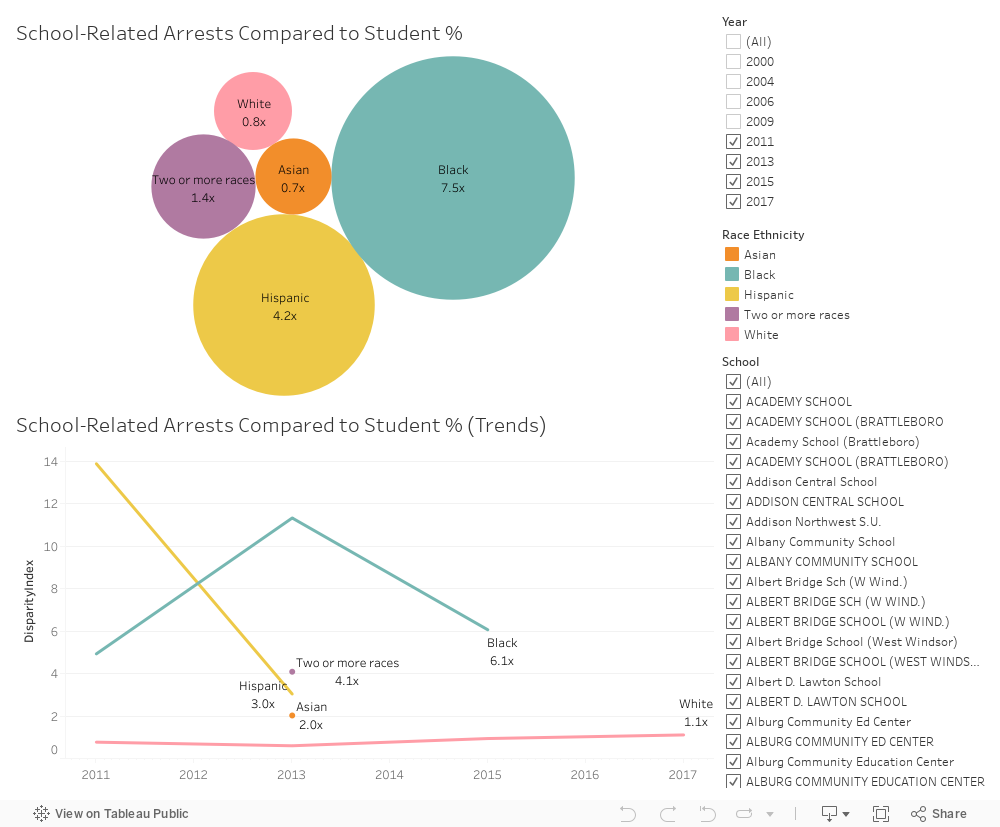
For 2011-2017, Black students were arrested due to an incident at school at 7.5x the rate of white students.
For 2011-2017, Black students were referred to law enforcement at 3.2 times the rate of white students.