Vehicle stops are one of the most common ways people have interactions with the police. Since 2014 Vermont law enforcement agencies have been required to gather information about traffic stops including race, gender and age of the driver. Analysis of this data can reveal racial disparities.
Racial Disparities in Stop Frequency
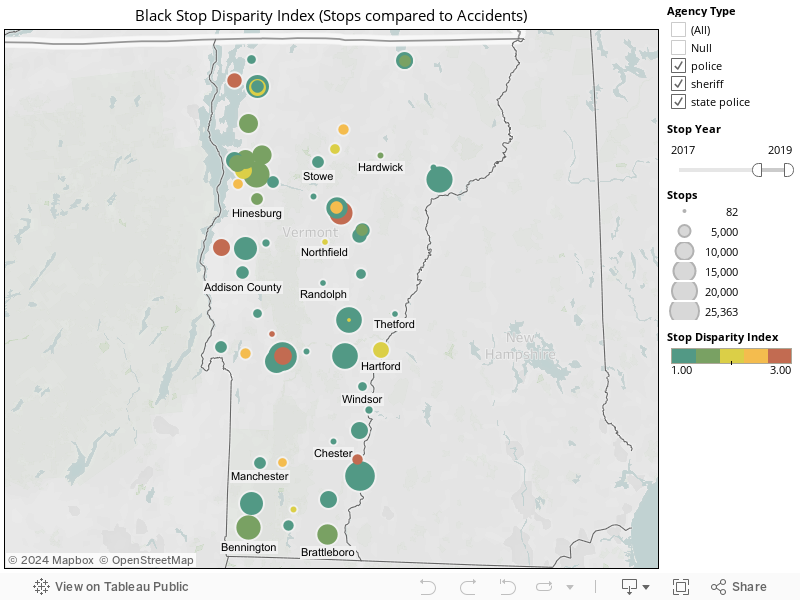
The following chart highlights differences in rates that black drivers are stopped (for any reason) compared to the rate of traffic accidents (as reported by the Vermont DMV) for that group. Using accident records is a good way to estimate the percentage of drivers by race for an area.
In the chart below, each circle corresponds to a law enforcement agency. The size of the circles in the chart reflects how manytraffic stops happened in the available data. Red circles highlight law enforcement agencies where black drivers werestopped at least three times as often as would be expected when compared to their driving percentage.
When exploring any chart, hover over or click on the circle to show details of the traffic stops for that agency.
Click on the map and hover over a circle to get details. Also, it is helpful to click the full screen icon to view the maps.
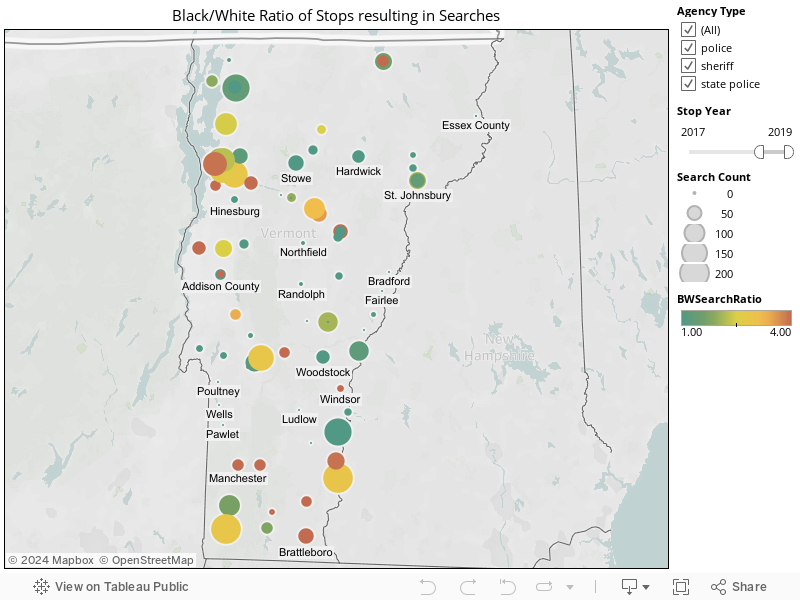
When a car is stopped, the officer may decide there is probable cause or reasonable suspicion to search the vehicle. The Vermont Traffic Stop data reveals how often, by race, a vehicle is searched once stopped.
Black/White Search Ratio
Some agencies consistently search vehicles operated by Black drivers more often than for white drivers. In the chart below, the red circles highlight agencies that are searching Black-driven vehicles four times as oftenas white-driven vehicles. The size of the circles shows the number of searches performed by an agency over the chosen timespan. Hover over a circle to get more information about the agency and the searches it is doing.
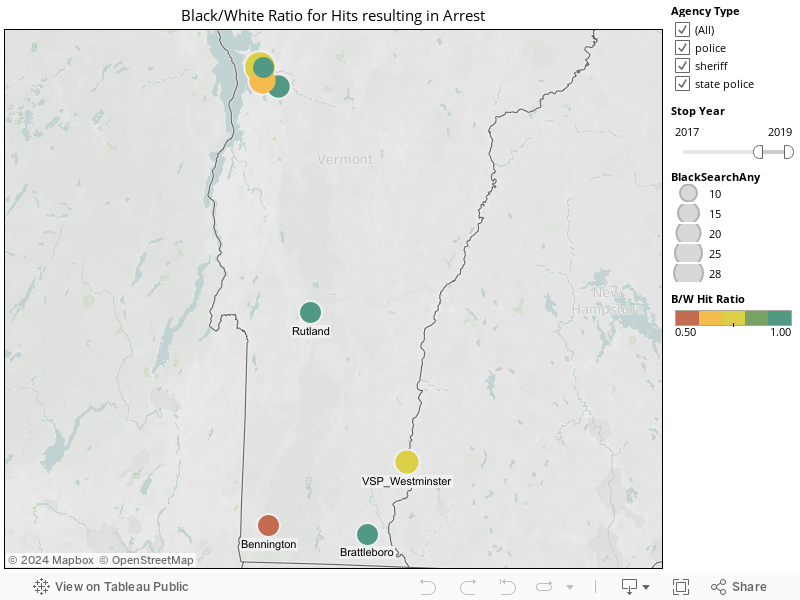
The traffic stop data reveals how often contraband is found (a “Hit”) once a vehicle is searched. If a group has a low “Hit” rate, that can indicate they are undergoing unnecessary searches. The next two charts compare hit rates for Black versus whites across all VT agencies where enough data is available. The size of the circles indicates the number of searches done. The agencies with Black hit rates much lower than whites are shown in red.
The first chart shows hits resulting in a ticket or arrest; the second shows just hits resulting in an arrest.
It is helpful to click the full screen icon the maps. Click on the map and hover over a circle to get details.
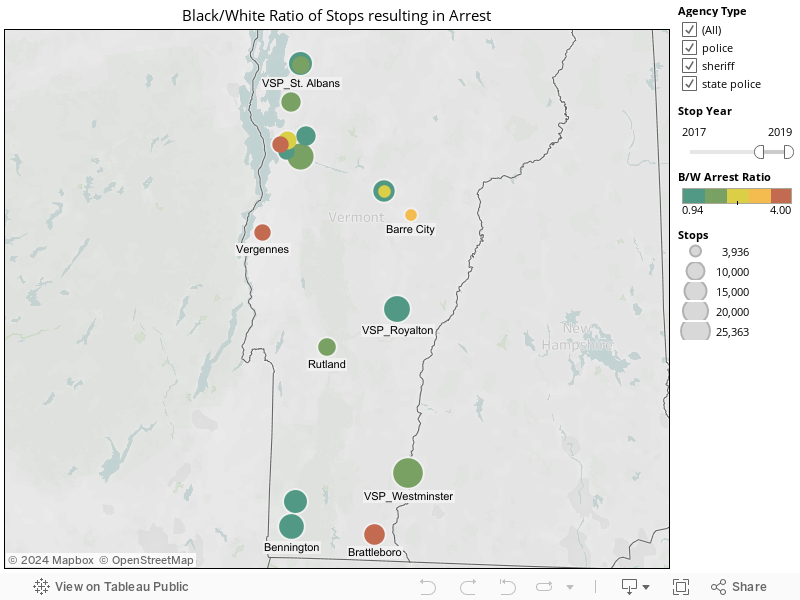
This section highlights potential racial disparities in the outcomes of traffic stops. Any traffic stop can result in a warning, one or more tickets, arrest or no action taken.
Stops Resulting in Arrest
The following map compares how often stopped Black drivers are arrested versus white drivers. Each circle represents a VT law enforcement agency. The size of the circle shows how many stops were done by that agency in the selected time period. A red circle indicates Black drivers were arrested at least four times as often as white drivers by that agency during that timespan.
It is helpful to click the full screen icon the maps. Click on the map and hover over a circle to get details.
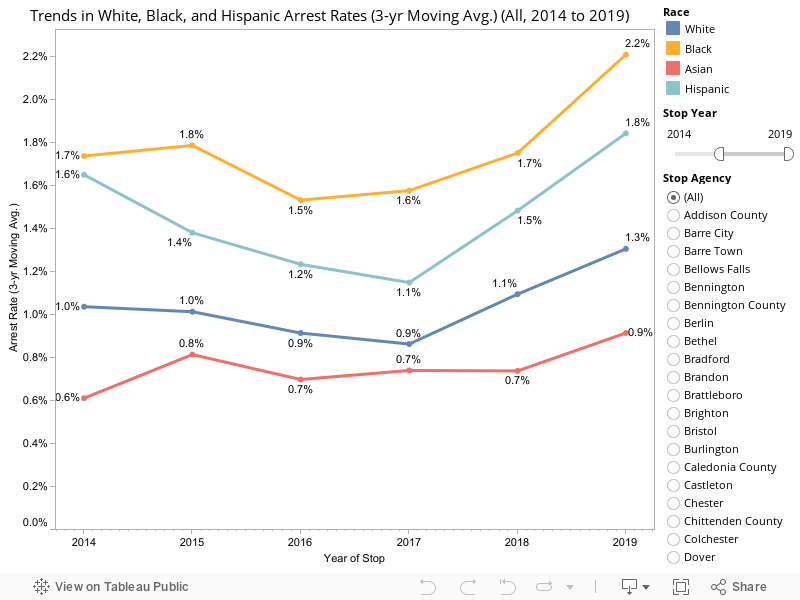
This chart shows how often arrests are made by race by the selected agencies. Select the agency you want to view on the right. The years of data available depends on the selected agency. Because of small sample sizes a 3-year moving average is shown. [ We would expect arrest to decrease or stay the same over time. ]
Stops Resulting in Tickets
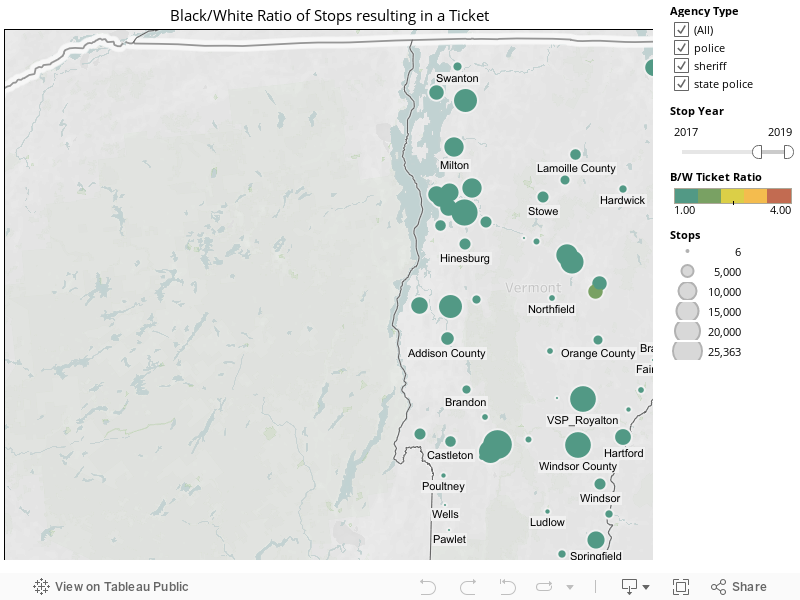
The following map compares how often stopped Black drivers are ticketed versus white drivers. Each circle represents a VT law enforcement agency. The size of the circle shows how many stops were done by that agency in the selected time period. A red circle indicates Black drivers were ticketed at least four times as often as white drivers by that agency during that timespan.
Click on the map and hover over a circle to get details.
Further analysis and discussion of the Vermont traffic stop data can be found here: Seguino. S. and N. Brooks. 2017. “Driving While Black and Brown in Vermont.” Gund Institute, University of Vermont and Cornell University.