data

Criminal Justice

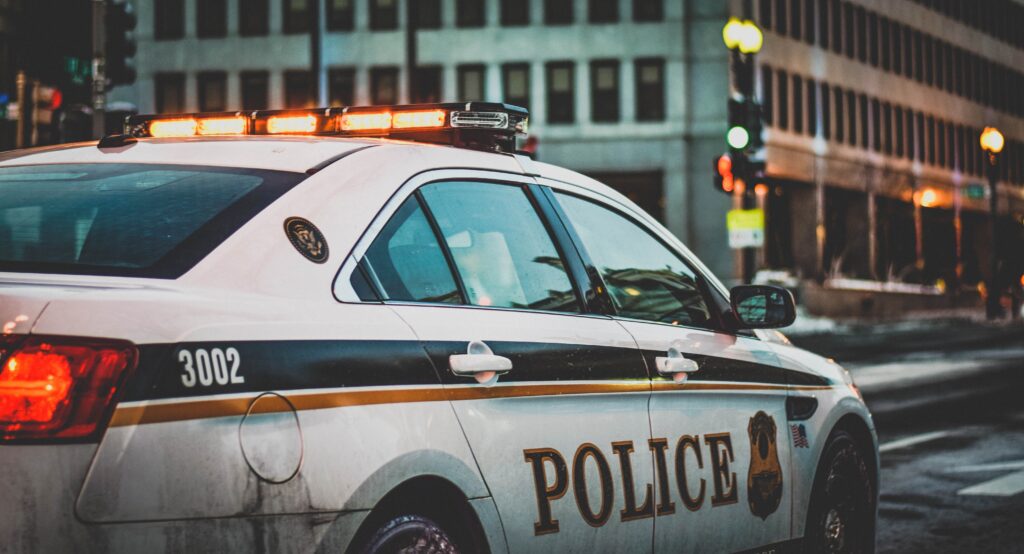
Vehicle stops are one of the most common ways people have interactions with the police. Since 2014 Vermont law enforcement agencies have been required to gather information about traffic stops including race, gender and age of the driver. Analysis of this data can reveal racial disparities.

Compare and contrast the Use of Force practices of the Burlington and Rutland police forces.

Explore the difference in charges, bail, and more in the Burlington area from 2017 to 2019.

These charts show the Vermont prison population counts and percentages by race.

Health and Wellness

Look at both the Behavioral Risk Surveys for Youth and Adults showing significant racial disparities affect physical and mental wellness.

View the racial disparities of COVID infections, testing, and deaths from the Vermont Health Departments website.

View the racial disparities of COVID vaccinations across the state.

Wealth, Land, and Home Ownership

View racial differences in Vermont unemployment for the five years from 2015 through 2019. 

There is a long history of wide differences between Black and white household incomes.  These charts show these disparities remain to the present day.

See racial disparities in Vermont poverty rates for
2015 through 2019. 

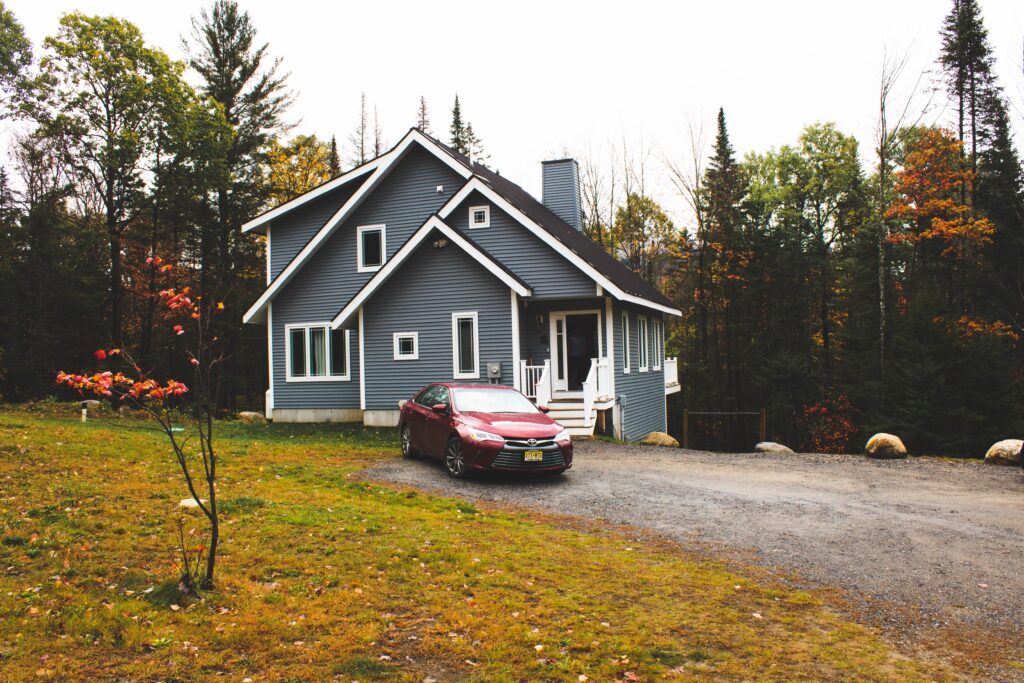
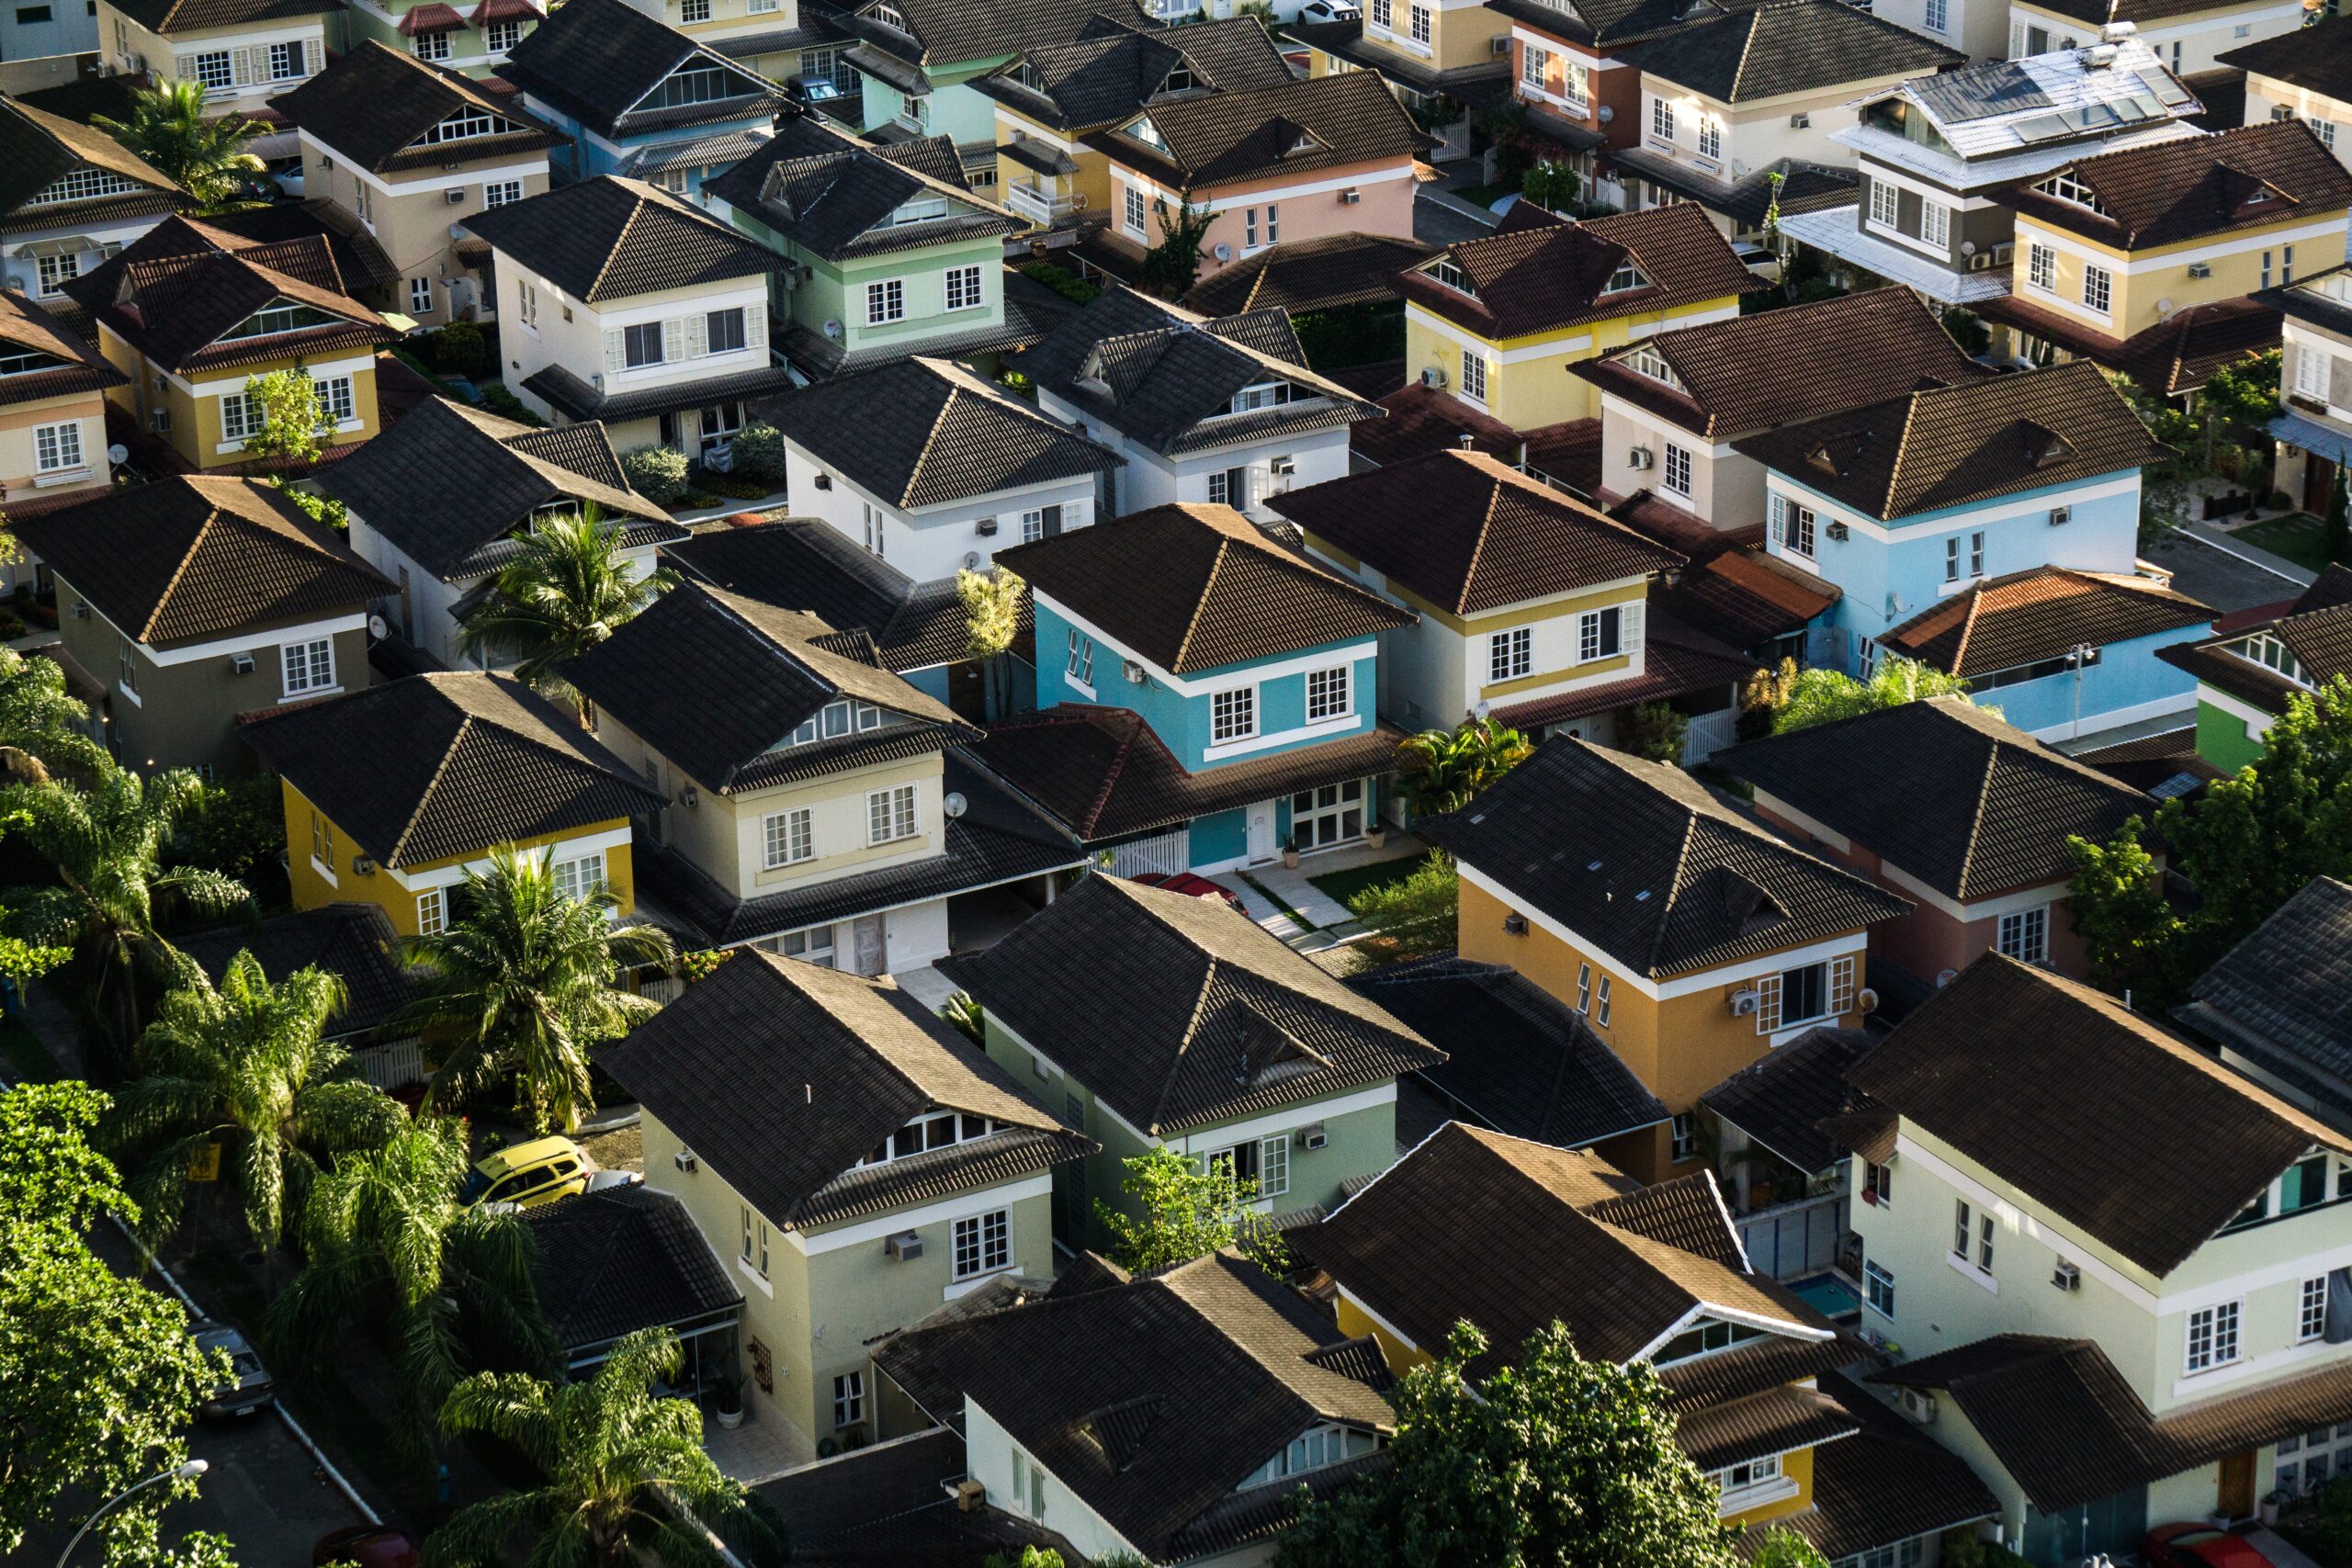
One way to measure the economic wellbeing of Vermont residents by race is to observe the percentage of housing units occupied by owners and by renters.

These charts show the wide disparities that remain for BIPOC farm ownership in Vermont.

Education

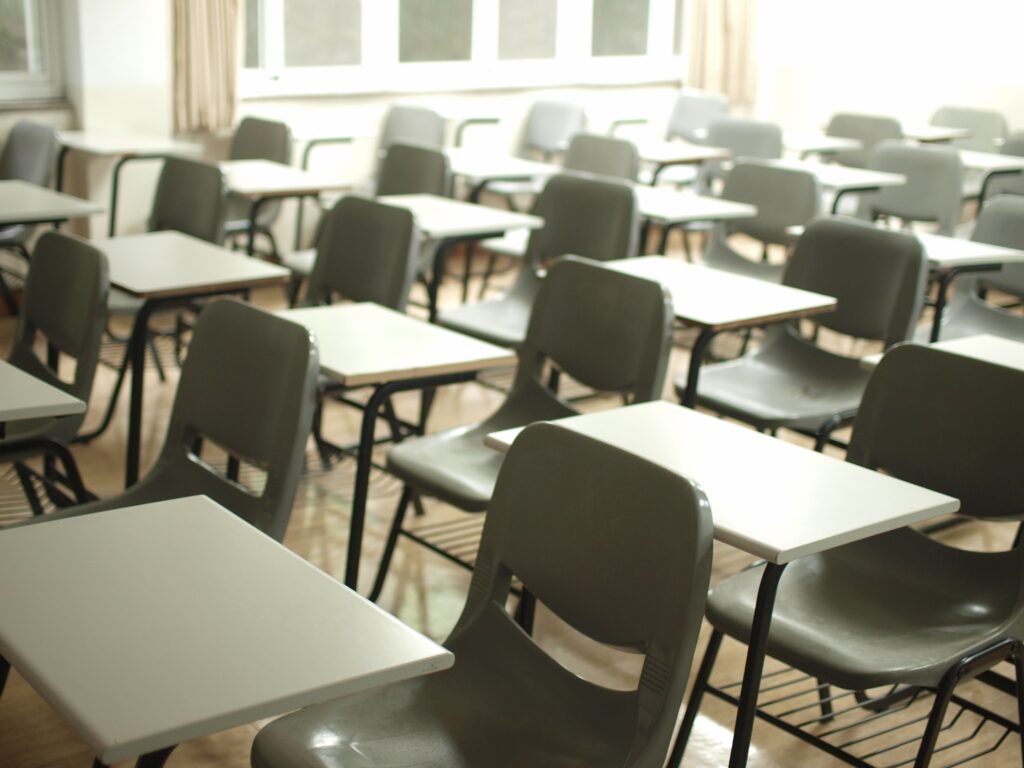
Vermont uses Smarter Balanced testing to assess learning for Grades 3 through 9.  Significant disparities are seen in the results between white and BIPOC students.

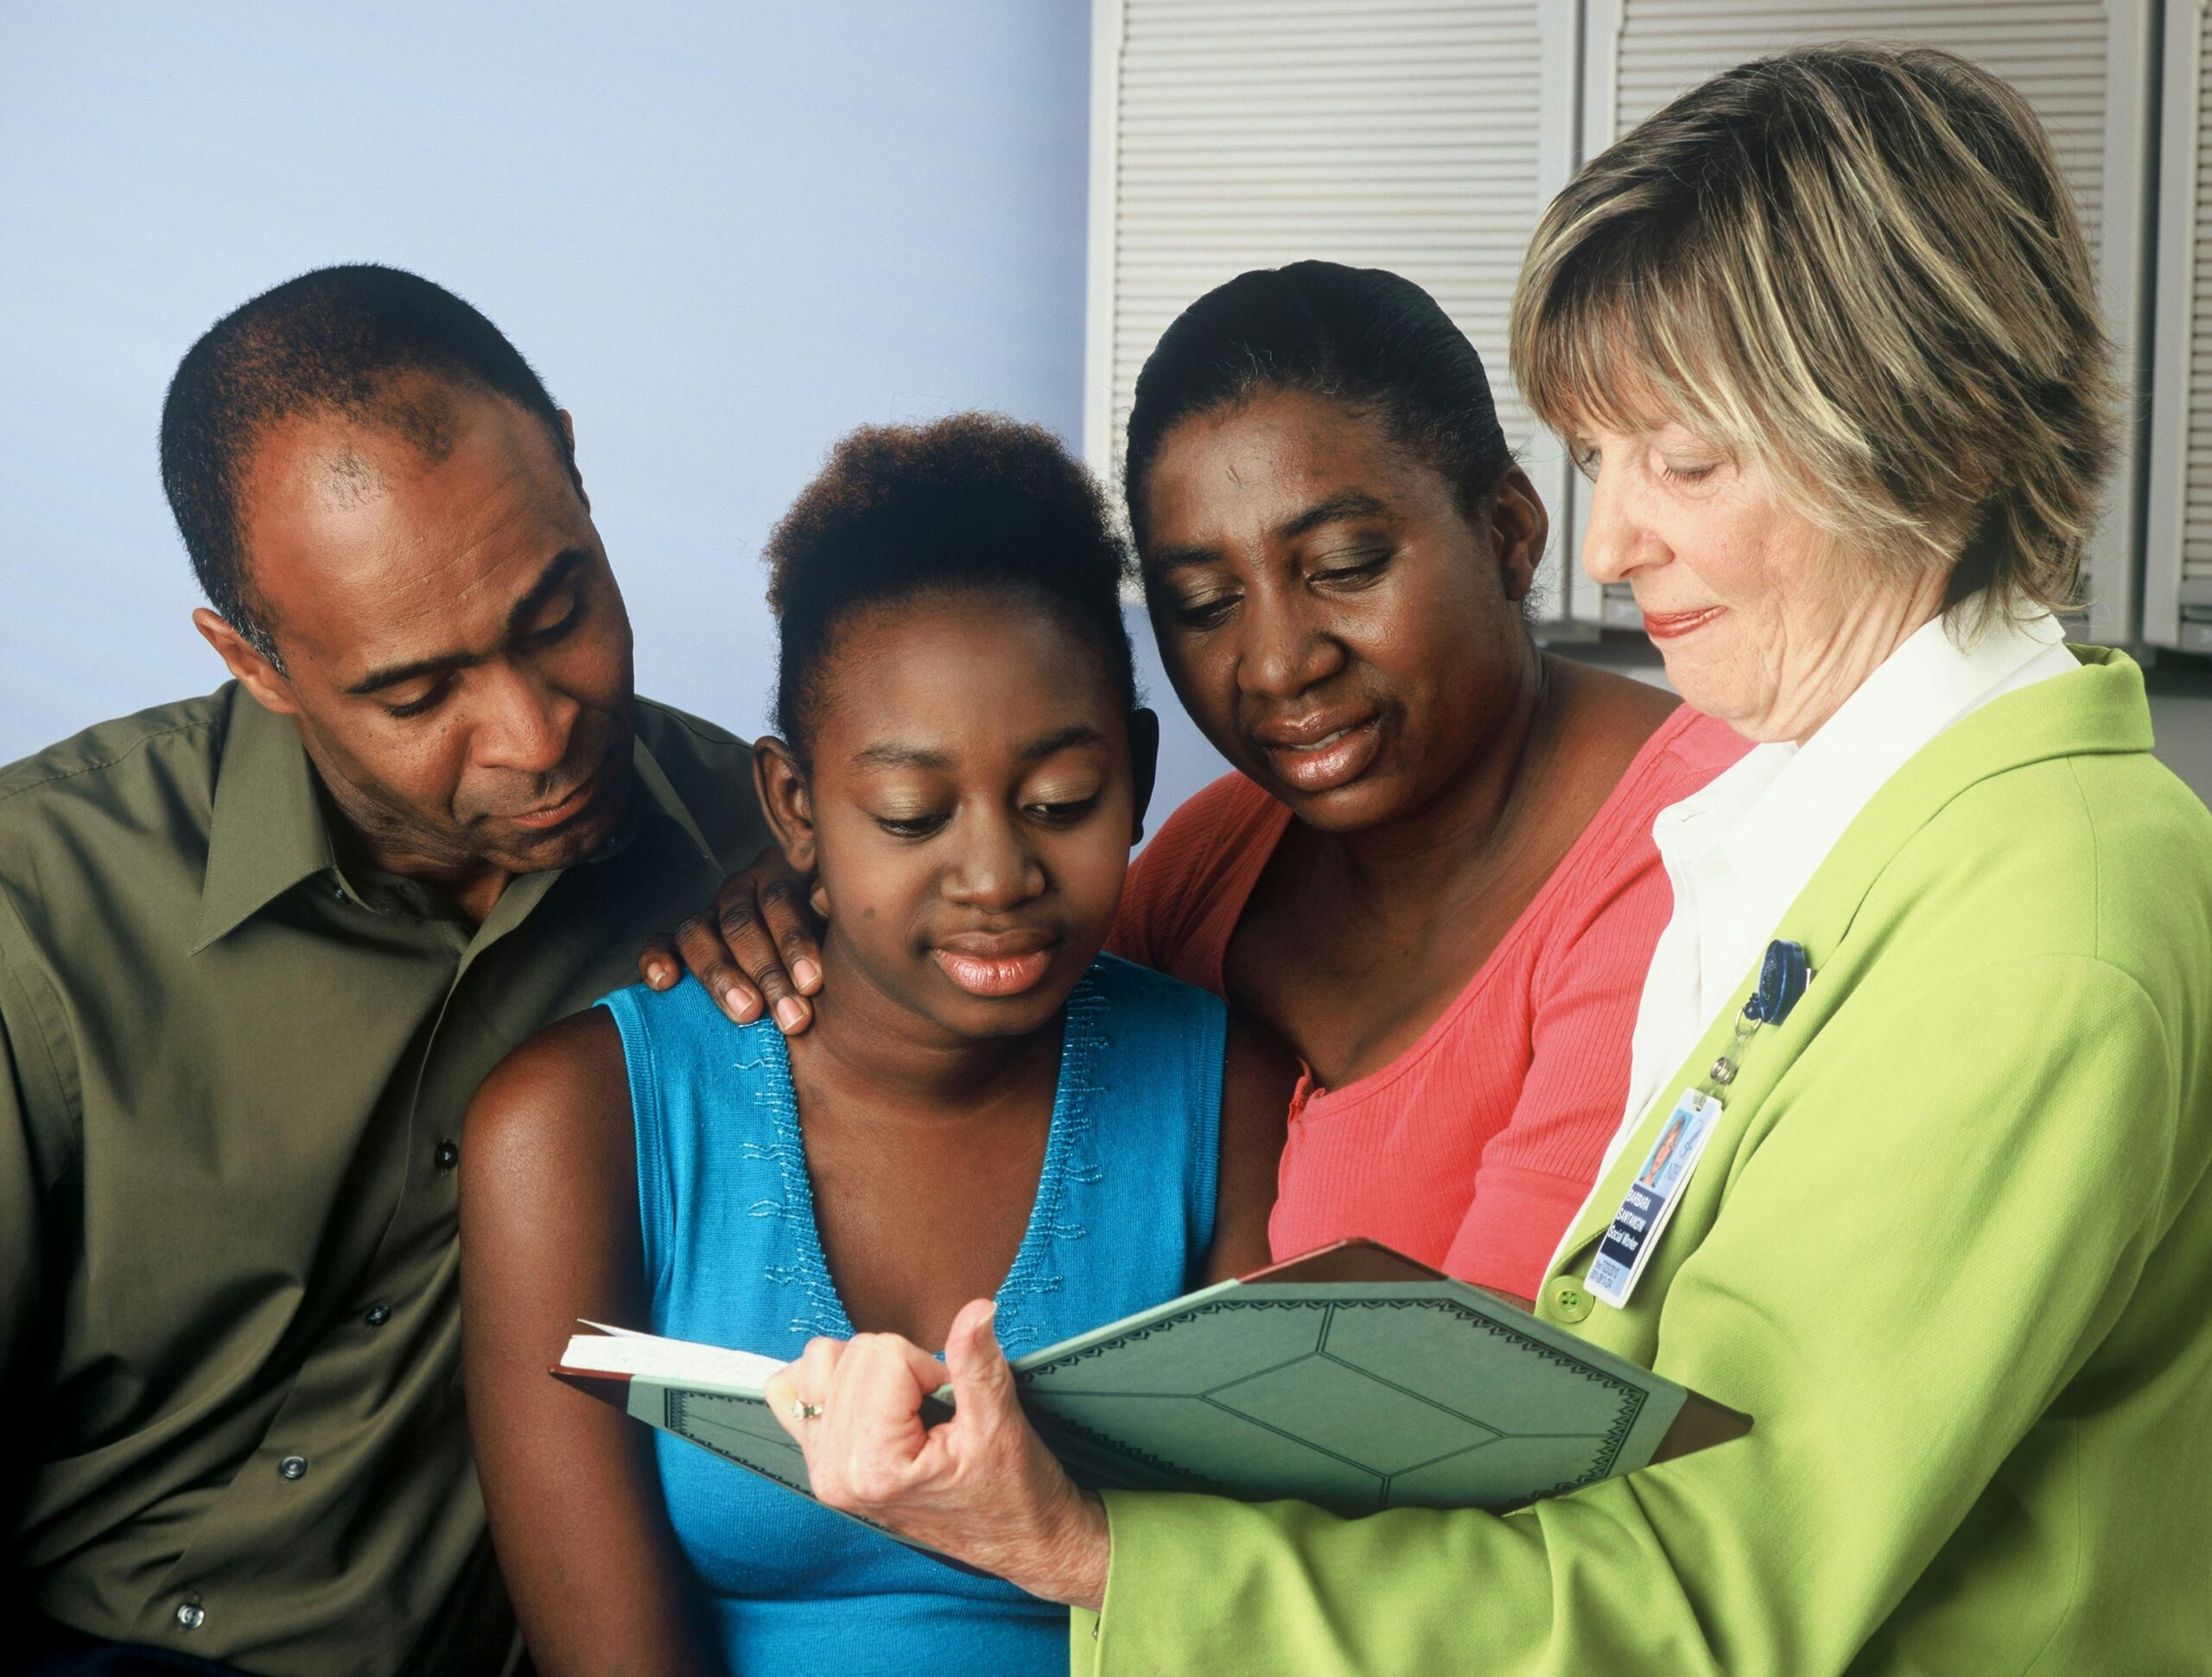
The U.S. Department of Education collects data on various forms of student discipline in public schools.  Racial disparities appear in the types and amounts of discipline used in Vermont schools.

These charts show differences by race in the number of among Vermonters with Bachelor’s degrees.